MLB Same Game Parlay Tips: Baseball Betting Strategy
 Available in US
Baseball’s daily rhythm and statistical depth create unique opportunities for same game parlay betting. With games nearly every day during the marathon 162-game regular season and extensive statistical tracking dating back over a century, MLB offers analytical bettors more data to work with than perhaps any other sport. But baseball’s inherent variance, where even the worst teams beat the best roughly a third of the time, demands different strategic thinking than football or basketball SGPs. The same game parlay in baseball rewards patient, research-driven construction rather than casual combination of appealing props.
The nature of baseball itself shapes SGP strategy. Unlike continuous-action sports, baseball consists of discrete plate appearances where one player faces one pitcher in isolation. This structure means correlations work differently. A hitter’s success depends heavily on the specific pitcher he faces, creating matchup-specific dynamics that general statistical averages can obscure. Understanding these granular matchups while maintaining awareness of broader game context separates profitable MLB SGP bettors from those who simply stack props and hope.
Starting Pitching as Foundation
Every MLB same game parlay should begin with analysis of the starting pitchers. In no other sport does a single player exert as much influence over game outcomes. Starting pitchers typically throw five to seven innings, meaning they directly face perhaps 20 to 30 batters while influencing the opposing lineup’s performance throughout their time on the mound. Building SGPs without anchoring them in starting pitcher analysis is building on sand.
When an elite pitcher takes the mound, expect suppressed offensive production from the opposing lineup. His team benefits from typically facing more favorable bullpen matchups after the opposing starter exits. This creates correlation opportunities: the elite pitcher’s team should cover spreads, game totals should trend under, and opposing hitters should underperform their season averages. Stacking these logically connected outcomes forms the foundation of coherent construction.
Pitcher strikeout props deserve particular attention because they correlate directly with the matchup. High-strikeout pitchers facing strikeout-prone lineups create natural overs on the pitcher’s K total. But the number of innings pitched affects this prop significantly. A pitcher who dominates through seven innings accumulates more strikeouts than one lifted after five, regardless of per-inning rates. Consider expected pitch counts and bullpen management tendencies when projecting strikeout totals.
Pitcher performance varies by handedness matchup. Many hitters show dramatic splits between their performance against right-handed versus left-handed pitching. When a left-handed pitcher faces a lineup stacked with right-handed bats, those batters may see significant advantages. Conversely, lineups heavy on same-handed hitters against a same-handed pitcher often struggle. These splits should inform both team totals and individual hitter prop selections.
Hitter Props and Lineup Dynamics
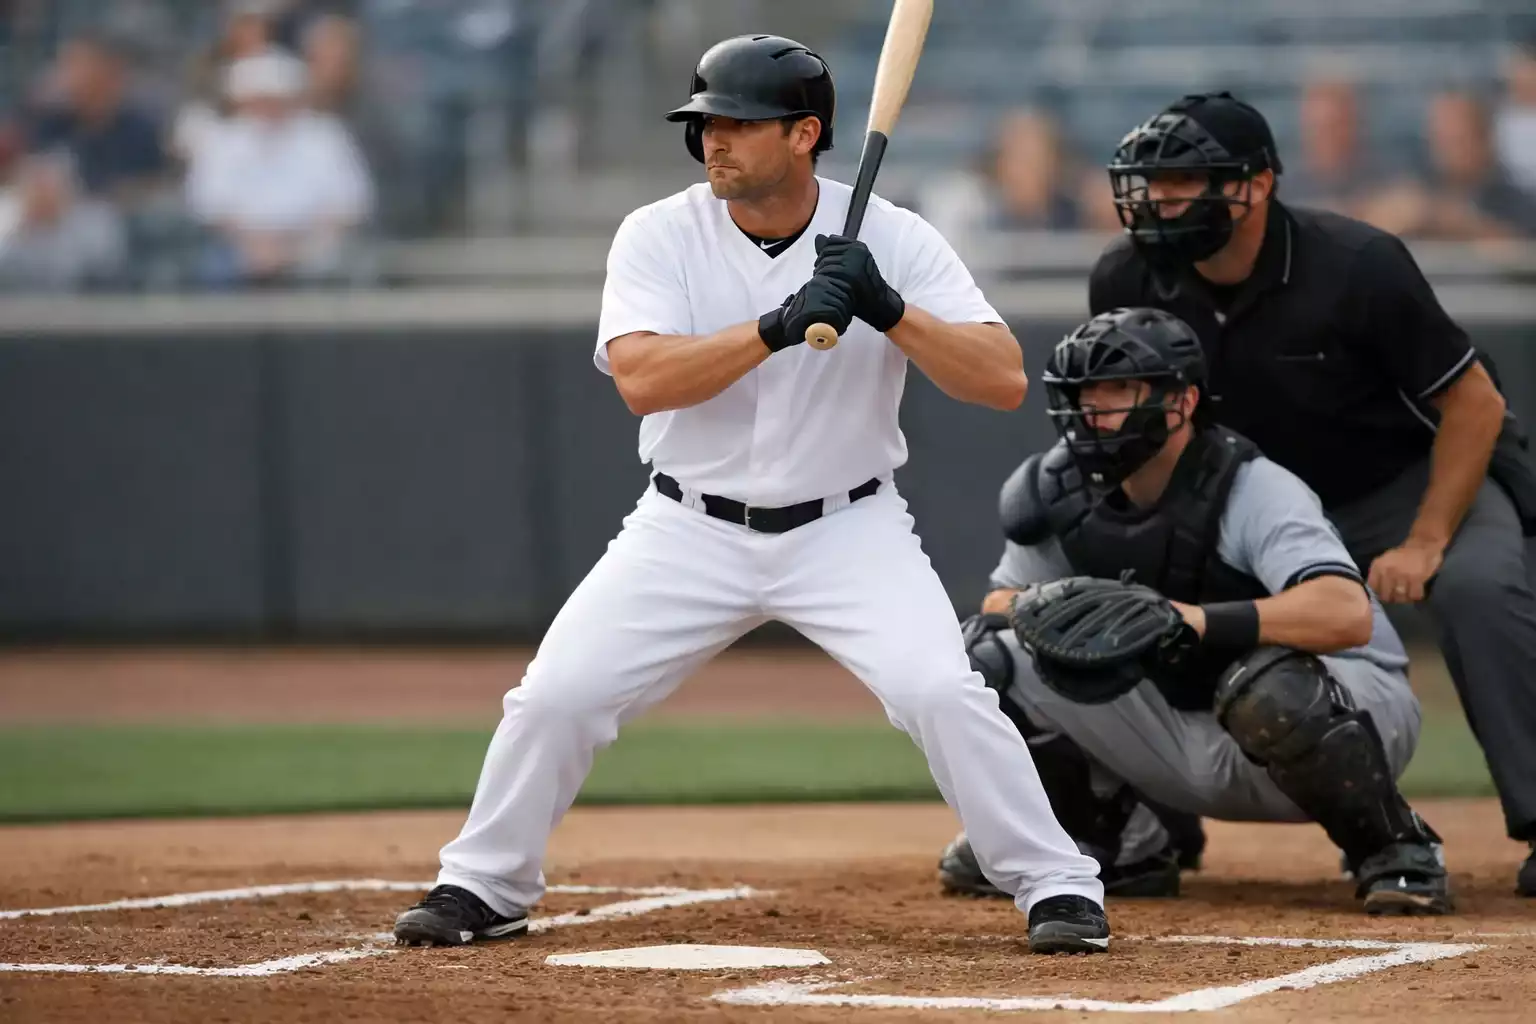
Position player props in baseball revolve around hits, runs, RBIs, total bases, and home runs. Each carries different variance profiles and correlation patterns worth understanding before including them in your SGP construction.
Hits are the most common outcome for successful plate appearances, making hit props relatively lower variance compared to home runs. A player might hit 25 home runs across a season but rack up 160 hits. When building conservative SGPs, hit props for consistent contact hitters facing favorable matchups offer more reliable foundations than volatile home run props. The over on a leadoff hitter’s hits prop, combined with team run totals, creates positive correlation since runs typically require baserunners.
Home run props carry massive variance but also massive upside when they hit. Even elite power hitters succeed on home run props only about 20-25 percent of the time on any given day. Including home run props in SGPs requires understanding that you are adding significant volatility. The payoff can be substantial when combined with correlated outcomes like team totals and runs scored, but expect most such constructions to lose.
Total bases props combine singles, doubles, triples, and home runs into one number, smoothing some variance while maintaining meaningful upside. A player can hit their total bases over through multiple singles or a single extra-base hit, providing multiple paths to success. These props work well in SGP construction for bettors seeking balanced risk-reward profiles.
Lineup construction and batting order position influence prop expectations. Leadoff hitters see more plate appearances than eighth-place batters, mechanically increasing their opportunity for hits and runs. Cleanup hitters face runners on base more often, boosting RBI opportunities. Understand how batting position creates different statistical distributions for similar quality players.
Weather and Ballpark Factors
Baseball is played outdoors in most venues, making weather a crucial SGP consideration that other sports rarely demand. Temperature, wind, humidity, and precipitation all influence ball flight and therefore offensive production.
Warm air is less dense than cold air, allowing batted balls to carry further. Games played in summer heat tend toward higher scoring than chilly April contests, even controlling for other factors. This affects not just game totals but individual home run and extra-base hit probabilities. When building SGPs for games in warm conditions, lean toward offensive overs across multiple markets.
Wind direction relative to ballpark orientation creates significant effects. Wind blowing out to center field helps balls carry for home runs while wind blowing in suppresses power. Wrigley Field is notorious for this effect, with identical matchups playing dramatically differently based on wind conditions. Check wind forecasts for outdoor stadiums and consider how direction interacts with each specific park’s dimensions.
Humidity affects ball movement for pitchers. Humid conditions can reduce the effectiveness of breaking balls, potentially benefiting hitters. The physics are complex, but savvy bettors incorporate humidity into their pitcher analysis, particularly for pitchers who rely heavily on movement rather than velocity.
Ballpark dimensions vary enormously across MLB and influence outcomes in predictable ways. Coors Field in Denver plays as an extreme hitter’s paradise due to altitude effects on ball flight and expanded dimensions that turn outs into hits. Oracle Park in San Francisco suppresses offense with its cavernous outfield and dense marine air. Understanding which parks favor offense versus pitching provides crucial context for every prop you select.
First Five Innings Markets
Many bettors prefer first five innings markets for MLB SGPs because they isolate starting pitcher matchups while removing bullpen uncertainty. What happens after starters exit becomes less predictable, with varying relievers and matchup-dependent usage patterns. First five innings betting concentrates your analysis where it matters most.
First five moneylines remove the bullpen wildcard entirely. A team with an elite starter facing a weak one often carries substantial first five value even when full game lines reflect bullpen uncertainty. Building SGPs around first five outcomes creates natural stopping points for your analysis: you are betting on how the game unfolds while starting pitchers control it.
Run totals in the first five innings tend to be lower than full game totals proportionally, since approximately only half the game passes. But the variance can be lower as well since you know who is pitching throughout the period you are betting. Combining first five unders with elite starting pitcher props creates coherent defensive-oriented constructions.
NRFI props, standing for No Run First Inning, have become popular SGP components. They bet that neither team scores in the first inning, which tends to happen more often than naive probability suggests because first innings often feature pitchers at their sharpest facing unfamiliar looks. Stacking NRFI with unders on early-inning markets creates positive correlation around early-game pitching dominance expectations.
Correlation Strategies and Narrative Construction

The discrete nature of baseball creates different correlation dynamics than continuous-action sports. In football, a quarterback throwing for 300 yards implies his receivers accumulated those yards. In baseball, a pitcher striking out many batters does not directly correlate with his own team’s offensive production because the two occur independently. Understanding which correlations exist and which do not prevents construction errors.
Pitching dominance correlates with team winning but not necessarily with that team’s offensive explosion. When building around an elite pitching performance, you are betting on the opponent’s suppression rather than your team’s production. The winning team might score just three runs against a weak opposing starter while your ace allows one. This means combining low game totals with the better pitching team winning creates coherent logic.
Hitter props on the same team can positively correlate when the opposing pitcher struggles. If you expect a particular starter to get shelled, multiple hitters on the opposing team become likely to exceed their totals. Stacking three hitters’ hit props against a weak pitcher creates positive correlation: if one hits, the others likely face the same favorable conditions.
Negative correlation props offer odds enhancement at the cost of coherence. Betting on a pitcher’s strikeout over while also betting on an opposing hitter’s hit over creates tension: the more the pitcher strikes out, the fewer hits fall. Such constructions can offer enhanced odds but require both legs to hit independently rather than supporting each other.
Don’t miss out on our expert NHL bet builder strategy.
Managing Baseball’s Variance
No sport produces more variance than baseball. A 100-win team loses 62 times across a season. Individual game outcomes depend heavily on sequencing, quality of contact on individual batted balls, and countless micro-events that resist prediction. This variance must inform your SGP stake sizing and expectations.
Keep MLB SGP stakes modest relative to bankroll, even more so than other sports. The high variance means longer losing streaks before edge manifests. Flat staking at 0.5 to 1 percent of bankroll per SGP allows survival through inevitable cold spells while allowing volume to accumulate.
The long season creates opportunity for specialization. Bettors who develop expertise in specific divisions, specific ballparks, or specific pitching matchups can accumulate meaningful sample sizes over hundreds of games. This longitudinal approach suits MLB betting better than event-focused strategies that might work in football.
Avoid the temptation to parlay heavy favorites across multiple games. Baseball upsets occur nightly throughout the 162-game schedule. Those social media screenshots of six-figure parlay wins came from thousands of similar attempts that lost. Concentrated SGPs on single games with coherent logic outperform scattered multi-game parlays that require independent unlikely events.
The daily grind of MLB offers endless same game parlay opportunities, but that abundance requires discipline to navigate profitably. Ground your constructions in starting pitcher analysis, incorporate ballpark and weather factors, understand which correlations actually exist, and size stakes appropriately for baseball’s variance. This systematic approach transforms MLB SGPs from lottery tickets into legitimate betting vehicles.
Get the best betting insights on our homepage.
